

Automating marketing reporting across GA4, CRM and advertising
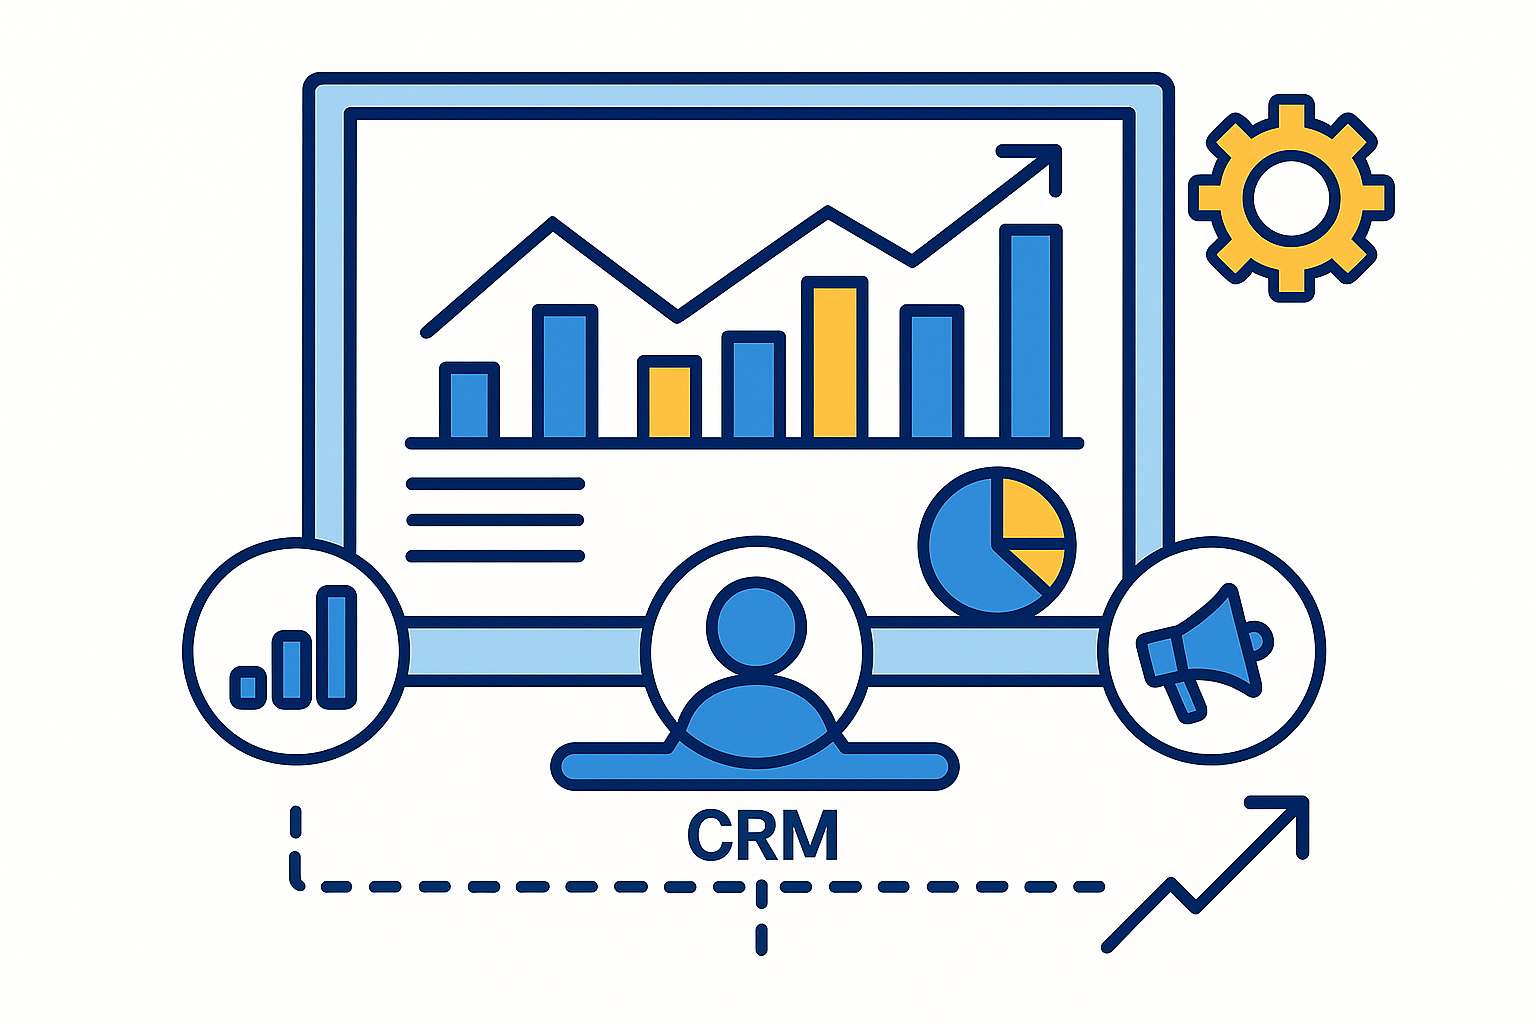
Today, marketing teams are facing a flood of data sources – from web analytics to CRM through to advertising accounts, email campaigns and social media. Each platform provides valuable information, but without automation, a data silo chaos quickly emerges. Numbers have to be exported manually, tables compared and KPIs updated manually – an enormous time eater with high risk of error
Automated marketing reporting solves exactly this problem. It connects all relevant systems, retrieves data in real time and brings them together in a central dashboard
This creates a complete picture of marketing performance – without copy paste, without Excel errors, without data breaks.
Companies that take this step win on two levels:
- More efficiency: Recurring tasks such as exports or summaries are eliminated.
- More precision: KPIs are automatically updated and visualized, making decisions based on current data.
An automated dashboard does not replace analysis, it improves it. Instead of spending hours with data collection, marketing managers can finally focus on what matters – Get insights, derive measures and optimize strategies
Why automated marketing reporting is indispensable
Today, marketing departments work with a variety of platforms – Google Ads, Meta, LinkedIn, CRM systems, newsletter tools, analytics. Each system delivers its own key figures, export formats and time periods. What looks like data diversity at first glance often leads to confusion and double-work in practice. Anyone comparing campaigns quickly notices: the numbers rarely match, and performance turns into chaos.
This is precisely where automated marketing reporting starts.
It creates order in the flood of data by automatically retrieves information from all systems, harmonizing it and transferring it to a uniform format. Whether clicks, leads, sales or conversion rates – all values are collected centrally, regularly updated and clearly visualized
The advantages at a glance:
Time savings: Manual exports and copy paste processes are completely eliminated
Data consistency: KPIs and metrics are automatically compared and standardized
Faster decisions: Current figures provide a reliable basis for daily optimizations
More focus on strategy: Less reporting effort means more time for analysis and creative measures
Automation doesn’t replace expertise – it strengthens it. Teams that automate their reports gain control, speed and transparency. Number columns become clear recommendations for action, and reporting becomes a real competitive advantage
Challenges of classic reporting processes
From Google Data Studio to Looker Studio – what has changed
Google has renamed its well-known visualization tool Data Studio 2022 into Looker Studio and at the same time has greatly expanded it.
While Data Studio used to be primarily an entry-level tool for Google data, Looker Studio is now a central part of the Google Cloud – with more opportunities, greater stability and deeper integration into professional data environments
Many marketers wonder what has changed in concrete terms.
The answer: the basic idea remained the same – visual representation of data from different sources – but the functionality was significantly expanded.
This has changed:
New name, same base: All existing data studio reports continue to work. Only the name and integration into Google’s Looker platform are new.
📊 More power under the hood: Looker Studio now supports complex data models, custom fields and automated updates in real time.
的 Better collaboration: Dashboards can be shared, commented and worked together for teams – ideal for marketing departments with several responsible parties.
的 Lower integration: By connecting to BigQuery and external data sources, CRM, ads and web data can be combined directly in a report.
This makes Looker Studio a real data hub for marketing teams.
Companies can merge, evaluate and enrich all campaigns – whether from GA4, Google Ads, Meta or HubSpot – in one interface.
The biggest advantage: Reporting is no longer a post-processing process, but part of the ongoing marketing process.
So those responsible always see how budgets work, channels perform and leads arise along the customer journey
Comparison: Google Data Studio vs. Looker Studio
Connect data sources – integrate GA4, CRM & Ads automatically
The basis of any functioning marketing reporting is a stable and clean data pipeline.
It ensures that information from all sources – for example Google Analytics 4, CRM systems, newsletter tools or advertising accounts – automatically converges in a central dashboard. Without this technical connection, reporting remains a patchwork of exports and tables.
To ensure that the data flows reliably, ETL-Flows (Extract, Transform, Load) are used. They form the backbone of every reporting automation:
🔍 Extract: The relevant data is regularly retrieved from GA4, Meta Ads, LinkedIn, HubSpot or other systems
Transform: different formats, Metrics and time zones will unified – for example clicks, leads or sales values
Load: The adjusted data is automatically loaded into the target system – for example in Looker Studio, a Data Warehouse or an internal dashboard
This process is fully automated – every day, hourly or at individual intervals.
Error monitoring and anomaly detection Irregularities are detected immediately: If, for example, a channel suddenly no longer sends data or a tracking parameter is missing, the system becomes active before wrong numbers end up in reporting
The result is a reliable data flow that depicts all marketing activities:
GA4 delivers web and user behavior, CRM complements customer information and conversion values, and the Ads platforms deliver cost and performance data.
This creates a complete picture of the customer journey – from the first click to the completed transaction
Example of an automated data pipeline
Structure Dashboards – from KPI standards to anomaly detection
A dashboard is more than a data collection – it’s the cockpit of marketing.
But many companies fail right here: too many figures, unclear structures, missing priorities. The result are reports that nobody reads because they contain everything, but don’t tell anything.
In order for reporting to offer real added value, it needs clear KPI standards and a comprehensible structure. Only when key figures are clearly defined can trends and successes be reliably measured.
A proven basic structure for marketing dashboards looks like this:
- Traffic & Acquisition – Visitors, sources, campaign performance, conversion paths
- Commitment – residence time, CTR, interaction rates, scroll depth
- Leads & Conversions – CRM data, financial statements, turnover contributions
- Costs & ROI – advertising budget, CPA, ROAS, cover contribution
Each of these areas provides its own perspective on marketing efficiency. Together they form the red thread from range through interaction to yield.
A professional dashboard does not only show data, but also detects if something is wrong.
Thanks to integrated anomaly detection, deviations are automatically reported – for example when the click rate of a campaign suddenly falls sharply, a data feed is interrupted or unusually high costs arise
Thus, reporting proactively instead of reactive. The system monitors itself, reports abnormalities in real time and ensures that problems are detected before they hide in the monthly report .
KPI groups and key figures for marketing dashboards
Automate workflows – from raw data flow to reporting in real time
Automated reporting doesn’t stop when it comes to visualization – it only really starts there.
Because the real efficiency gains occur, even if the update, review and distribution of the reports run automatically. Instead of exporting data manually, updating dashboards or sending results by email, automated workflows take over these tasks reliably in the background
A typical process could look like this:
“Retrieve GA4 data daily → sync with CRM data → Looker Studio Update dashboard → Send email report automatically to the marketing team
These workflows run according to a clear scheme – regularly, comprehensible and error-free.
This results in daily reports, which teams can rely on without having to hand themselves.
Example of practice:
- A campaign runs over Google Ads, Meta and LinkedIn.
- All data is automatically retrieved every day and merged into a central table.
- The Dashboard in Looker Studio updates automatically and sends the team an overview of the most important KPIs .
The effect is enormous: less coordination, no outdated numbers and more focus on decisions instead of data searching.
With clearly defined KPIs, structured data and intelligent automations, reporting becomes a strategic control tool.
What used to mean hours of manual effort today provides valid insights in real time – Marketing Intelligence on Autopilot
Typical automation workflows in reporting
Best Practices for Automated Marketing Reports
Automated reporting is only as good as the standards on which it is based.
In the absence of clear rules, inconsistencies arise – different numbers for the same KPI, different periods of time or inconsistent definitions. To make automation a real advantage, structure, data and processes must be clearly defined and documented
The key is consistent unification:
All systems should use the same logic, calculate the same metrics and follow the same update cycles, creating reports that are truly comparable – across campaigns, channels, and teams.
Best practices for reliable marketing reports:
CPI definitions clearly define: A “lead” should mean the same thing in all systems – regardless of whether it is captured via CRM, forms or Ads
的 Data frequencies vote: Daily or hourly update usually suffices – more often does not automatically mean better
Keep sources consistent: Old and new tracking methods must not be mixed, otherwise data breaks will occur
📧 Use automatic alerts: Systems should immediately send notifications in case of anomalies or data errors
Dashboard design for decision makers: Clear structures, uniform colors, logical KPI groups – so that data can be understood at a glance
So reporting becomes more than just data output.
A reliable information system is created that helps managers and teams to react to facts rather than to gut feeling
Checklist for a clean reporting setup
From the flood of data to the decision basis
Automated marketing reporting is not an IT project – it’s a real strategy change.
For those who build up their data flows, key figures and dashboards in a structured manner create far more than just transparency: it creates the basis for fact-based action.
Instead of drawing up reports retrospectively, marketing teams with automated systems can control forward-looking – customize campaigns in real time, shift budgets and identify trends before they appear in the monthly report
Companies that follow this path benefit several times:
- Faster decisions because all numbers are available at any time
- Less voting effort because each division accesses the same data set
- Higher planning security because reports not only describe, but lead
Automated reporting means finally to understand data as active control tool – not as a mandatory task.
If you want to automate your marketing reports – from GA4 through CRM to ads data – I will support you in building a reporting structure that delivers more than numbers: clear KPIs, clean data flows and a dashboard that makes decisions possible
FAQ: Frequently asked questions about automated marketing reporting
- What does automated marketing reporting mean?Automated marketing reporting describes the automatic collection, preparation and visualization of marketing data.
System call information GA4, CRM and Ads platforms regularly off
Data are unified, cleaned and displayed in dashboards like Looker Studio
decisions based on real-time data instead of manually created tables - What are the advantages of automated reporting?The main advantages are:
— Significantly less manual work and lower error rate
的 Higher data quality through automatic update
的 Uniform KPIs across all channels
Faster decision-making processes in marketing - What tools are suitable for automated reporting?Popular tools are:
的 Looker Studio (formerly Google Data Studio) – central dashboards and visualization
BigQuery – Data management for larger amounts of data
GA4 – Web analysis and user tracking
CRM systems such as HubSpot or Pipedrive – Leads & Conversions
The tools are usually connected via a data pipeline or ETL flow. - What are ETL flows and what are they used for?ETL stands for Extract, Transform, Load:
Data is extracted from systems such as GA4 or Ads
Formats and values are unified (e.g. clicks, leads, sales)
The adjusted data is automatically loaded into a dashboard
This creates a stable, automated data flow between all marketing platforms. - How often should reports be updated automatically?This depends on the amount of data and the objectives:
Daily reports are sufficient for most marketing teams
For large budgets or campaigns, an hourly update can also be useful
More important than frequency is the stability of data flows – no update should take over faulty values. - How does automated reporting remain GDPR compliant?For legally secure data use:
Use of EU servers or GDPR-compliant hosting options
ie Clear role distribution and access control in the team
Automatic deletion of outdated data
Documentation of the systems and data sources used
This ensures that reporting remains transparent and legally secure. - What KPIs belong in a good marketing dashboard?Key indicators are:
Range (Impressions, clicks, CTR)
Engagement (interaction rates, duration)
Conversions (leads, sales, ROAS)
Budget data (costs, CPA, ROI)
A good dashboard combines these values logically and makes successes like vulnerabilities visible. - How do I start with the automation of my reporting?Recommended procedure:
What KPIs and channels are crucial?
Setting up data connections (GA4, CRM, Ads, Newsletter)
Setting Dashboard Structure
Configure Automatic Updates and Alerts
Start with small reports – then expand it step by step.
Schreibe einen Kommentar zu "Automating marketing reporting across GA4, CRM and advertising"